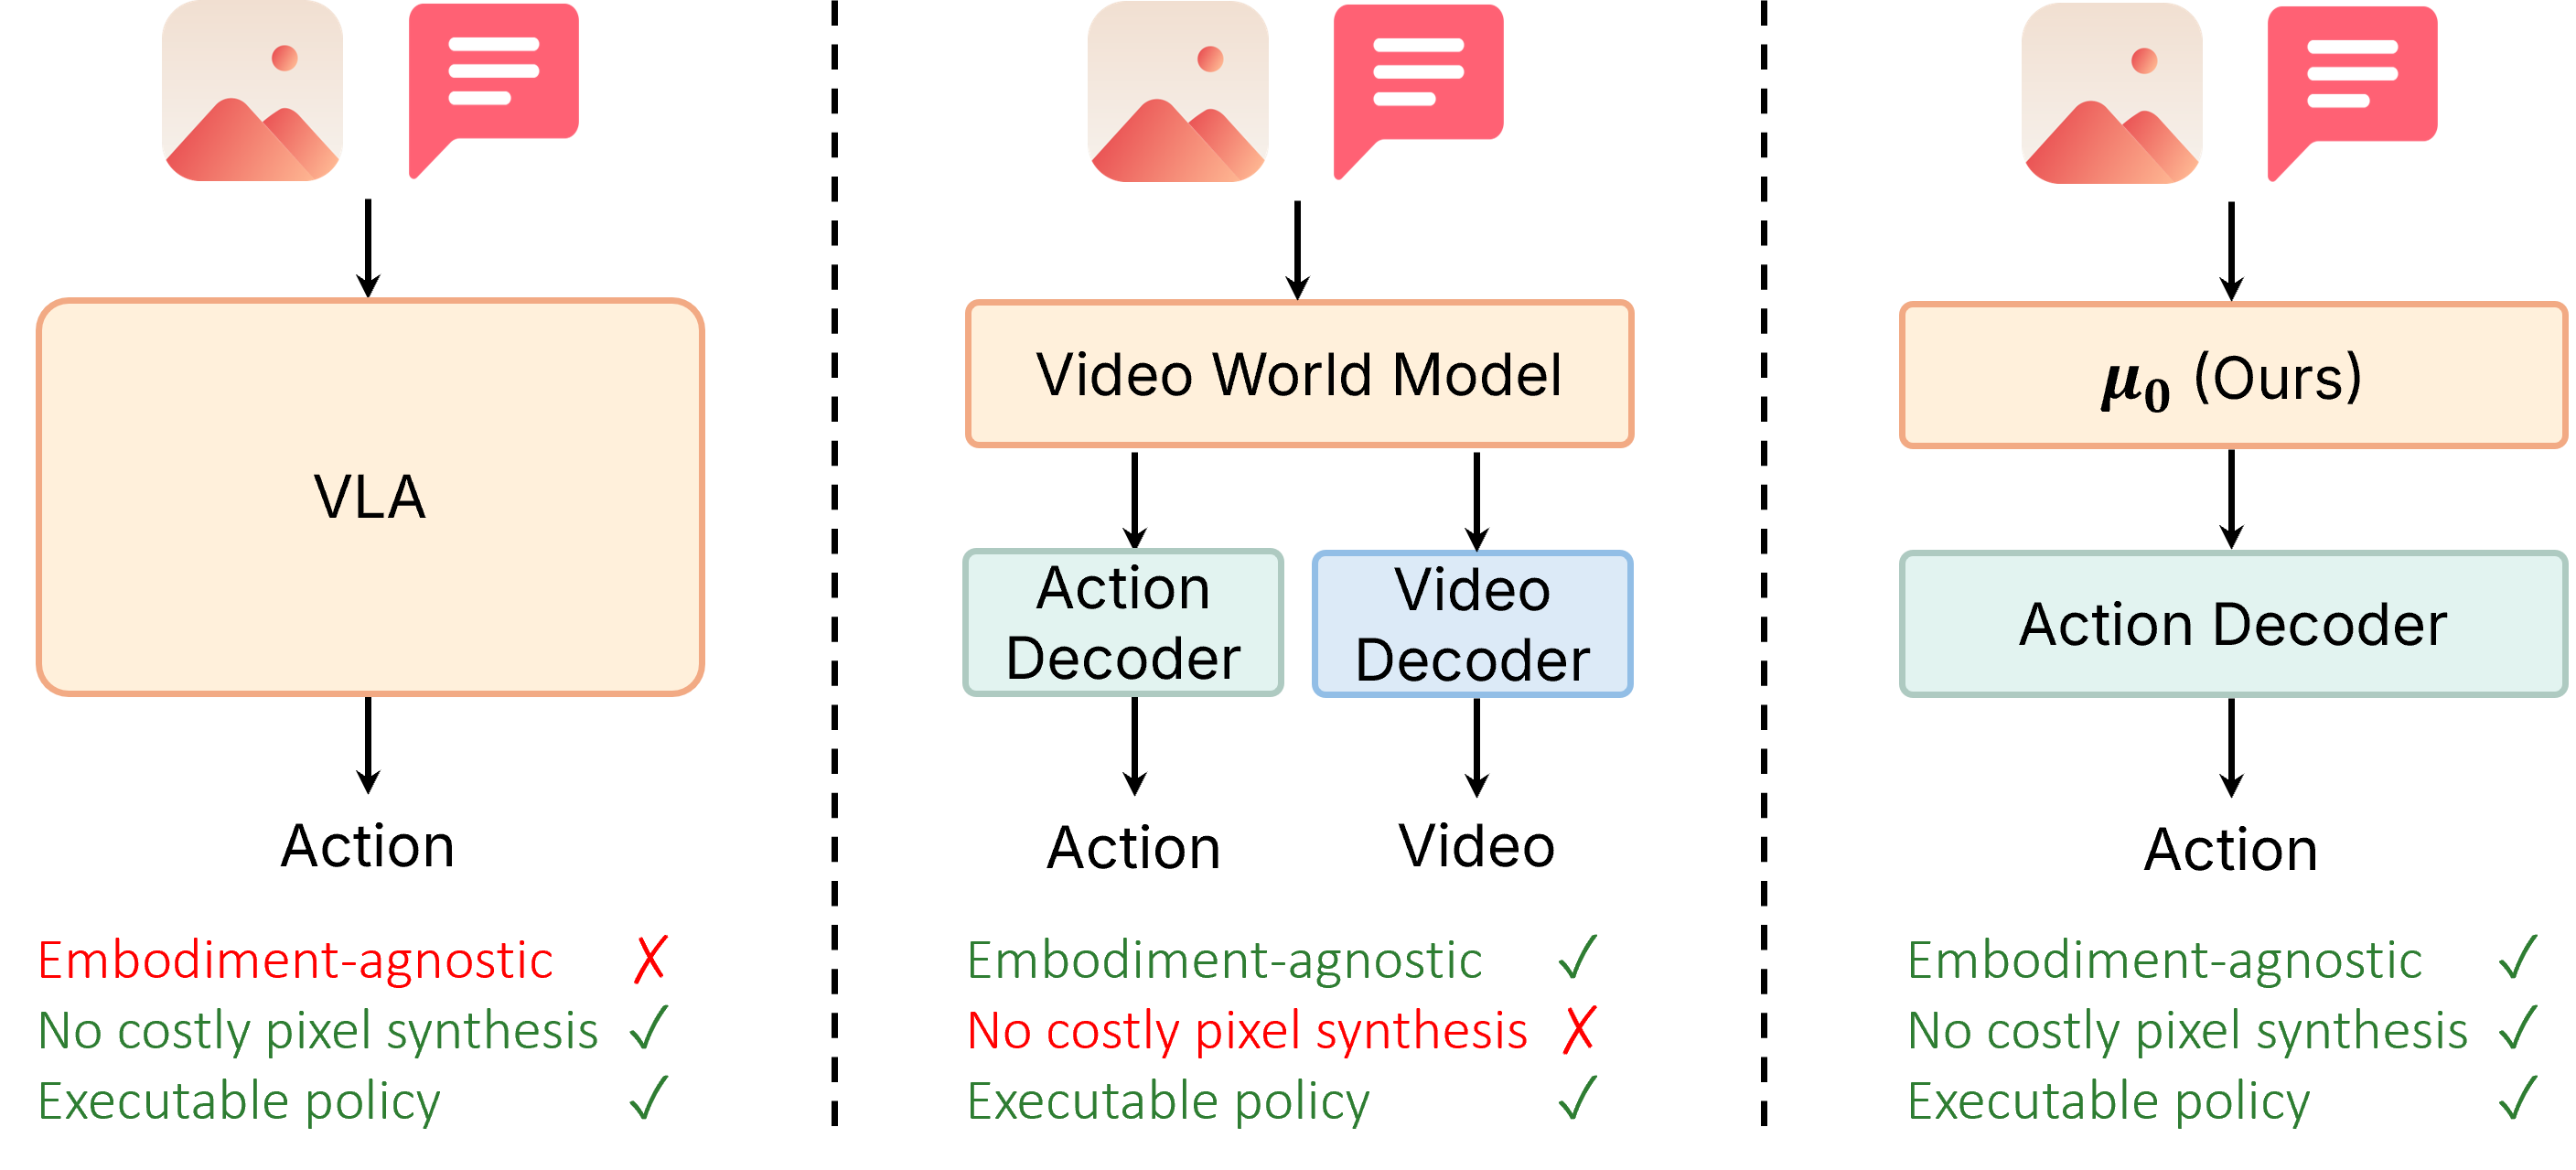
Pixel-space video models burn capacity on appearance, while action-labeled VLAs are bound to specific embodiments. μ0 occupies the middle ground: it predicts 3D traces of semantic interaction points — objects, tools, hands, and contact regions — that compactly describe what must move, regardless of the robot used.
Qualitative comparison of predicted traces from μ0 against trace-prediction baselines.
Input
Ground Truth
Prediction
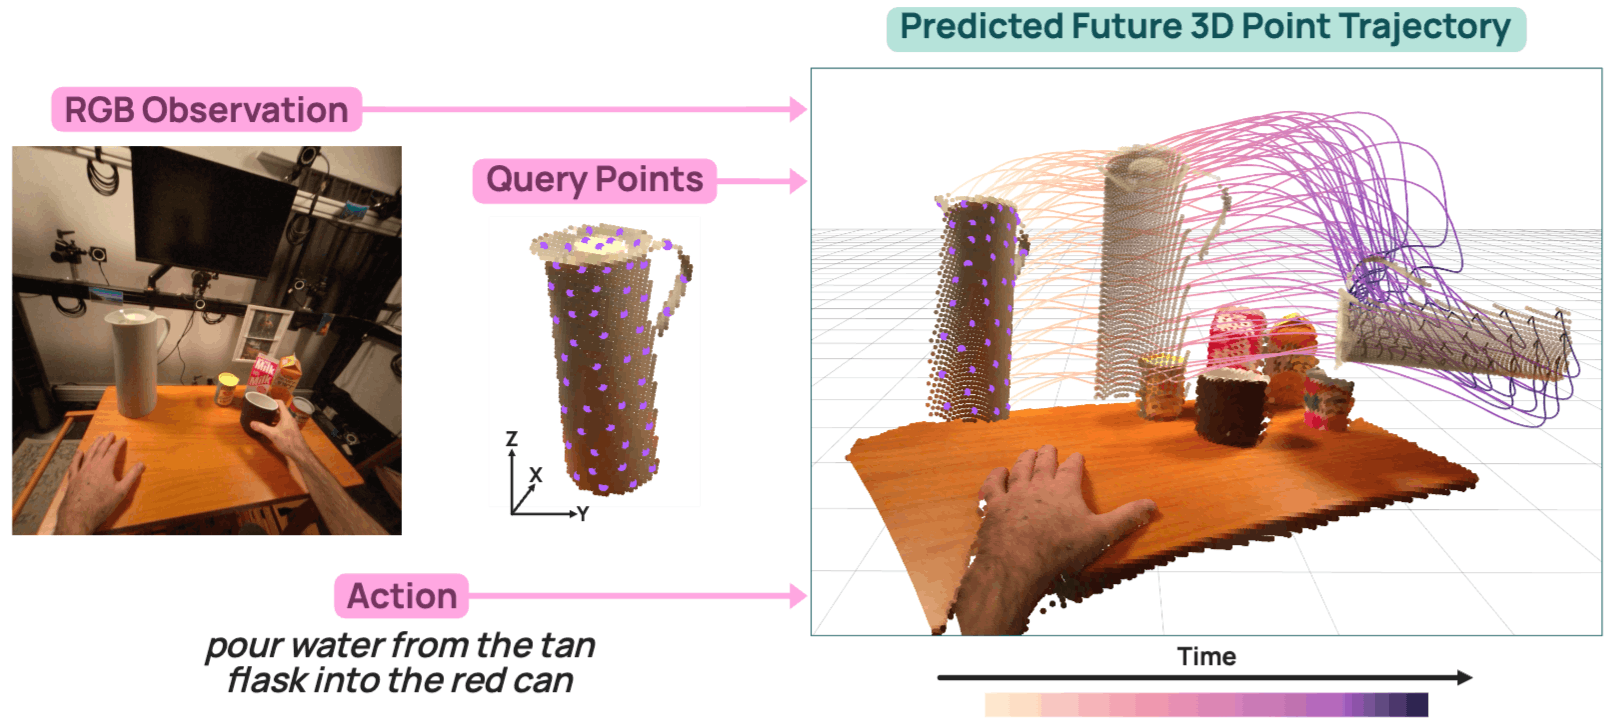
Interactive 3D trace predictions from μ0. Drag to orbit, scroll to zoom. The input frame is shown in the top-left; predicted trajectories are colored by time (purple → red). Pick a sample below.
μ0 + action expert reaches 30.25% average success across 8 RoboCasa365 tasks, outperforming π0 by 5.0 points and TraceGen + action expert by 7.25 points despite relying solely on video-only pretraining.
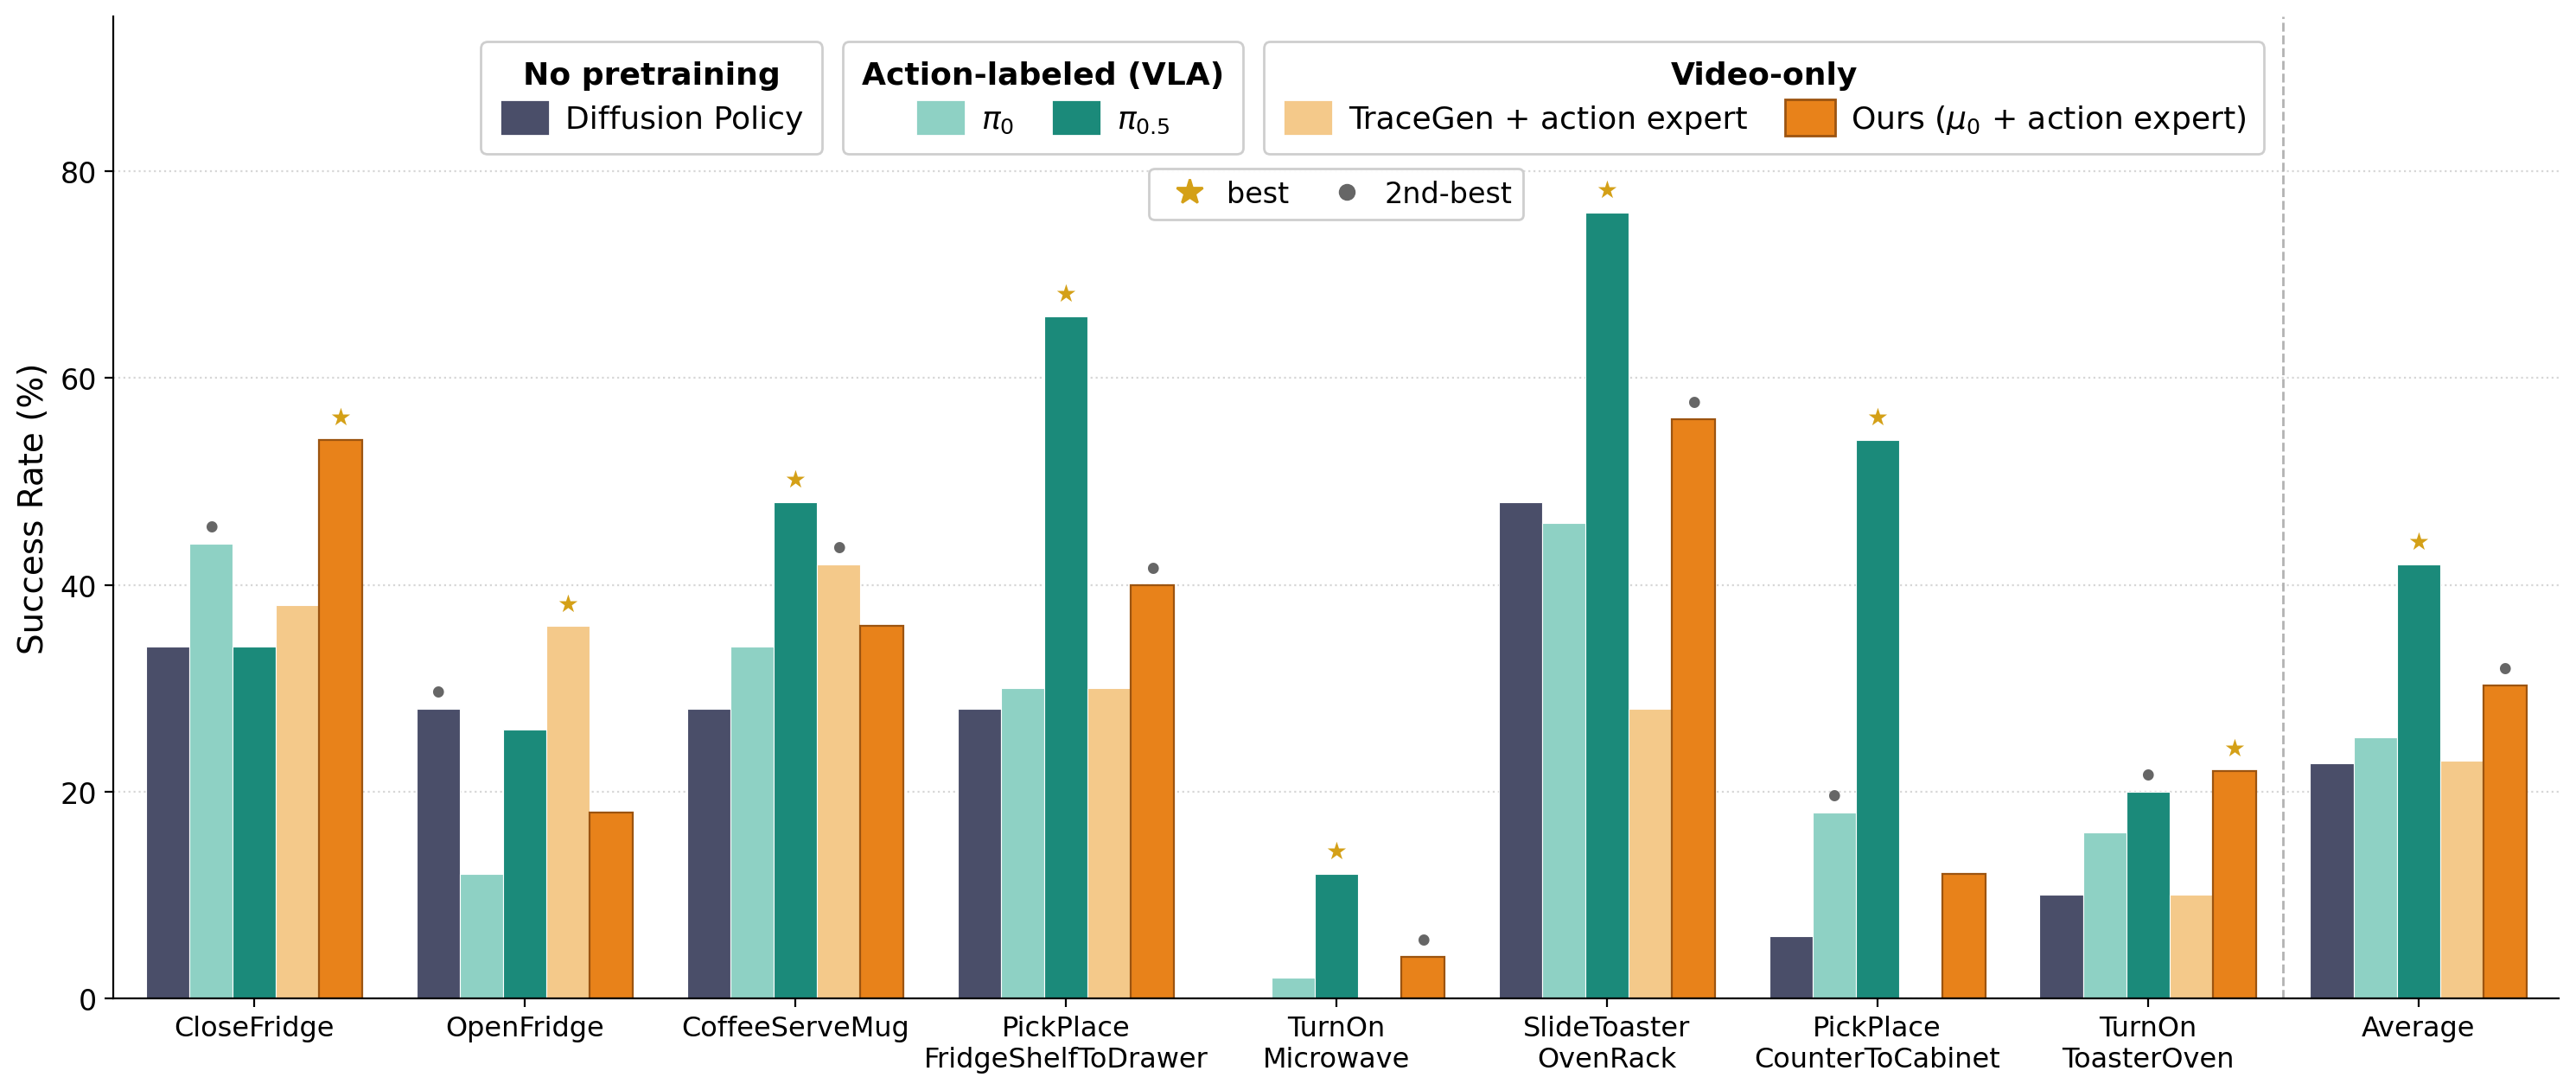
Simulation results in RoboCasa365. Success rates (%) on 8 representative RoboCasa365 tasks.
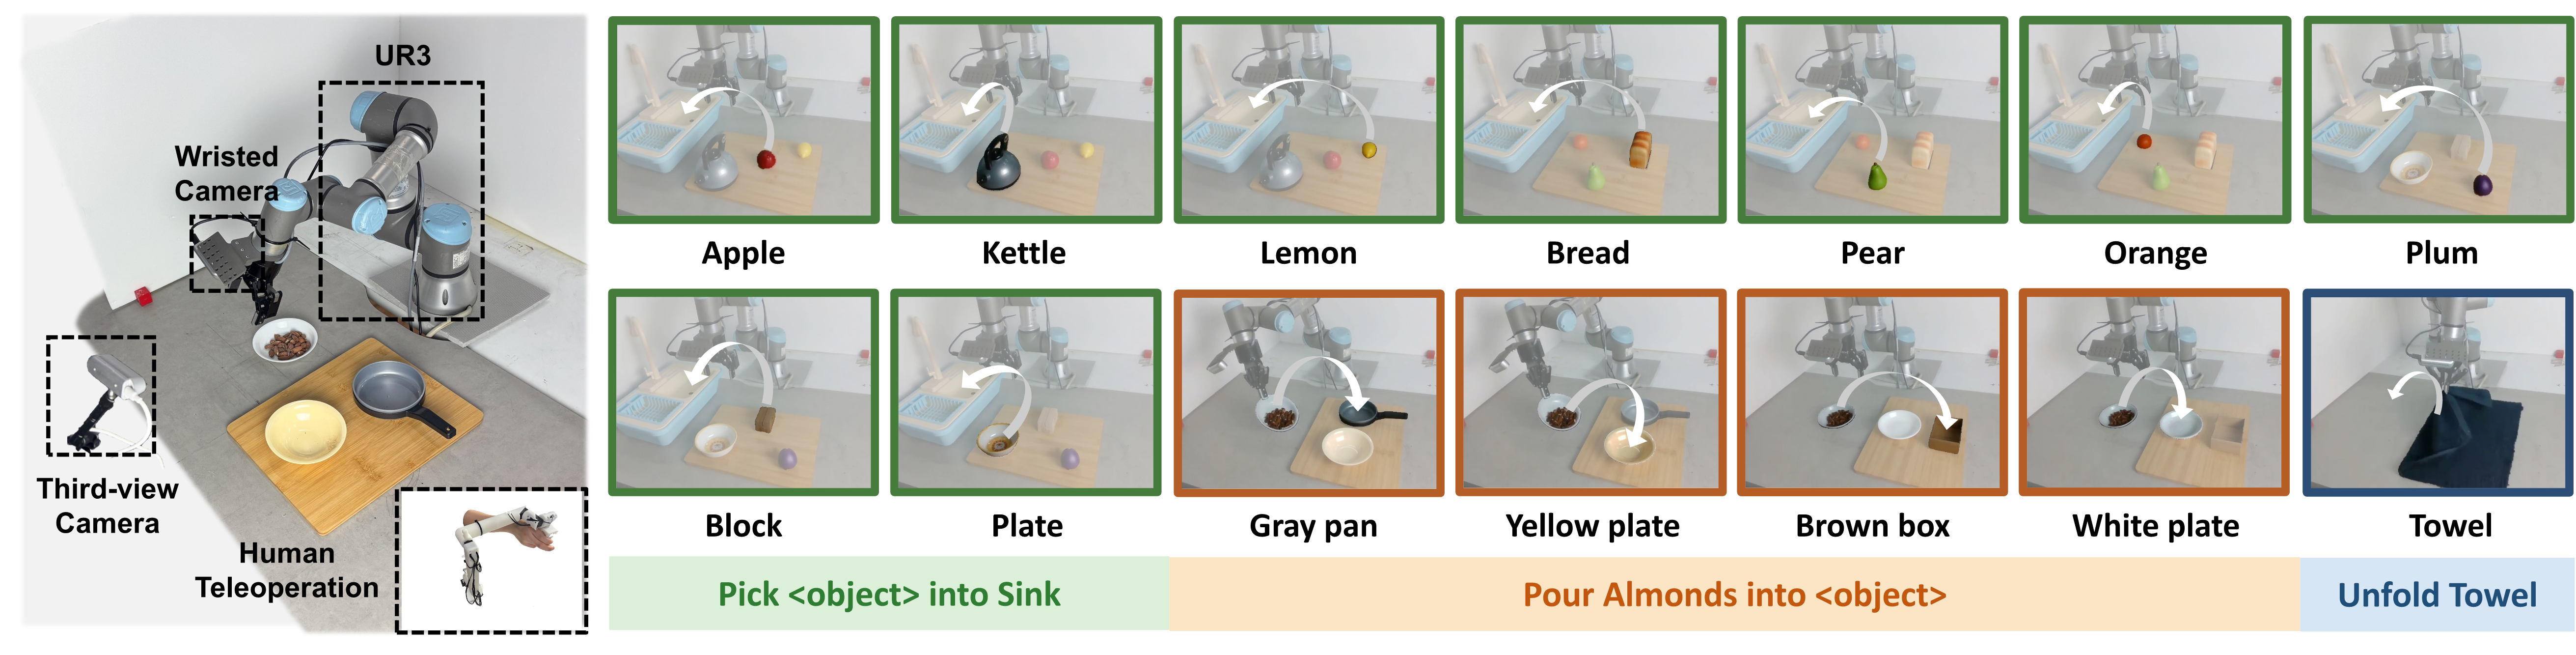
Real-world experimental setup and task visualizations. The setup includes a UR3 robot arm with a two-finger gripper and the three real-world manipulation tasks used for evaluation.
Real-robot rollouts, speed up 5×.
VLM + action expert
π0
π0.5
TraceGen + action expert
Ours (μ0) + action expert
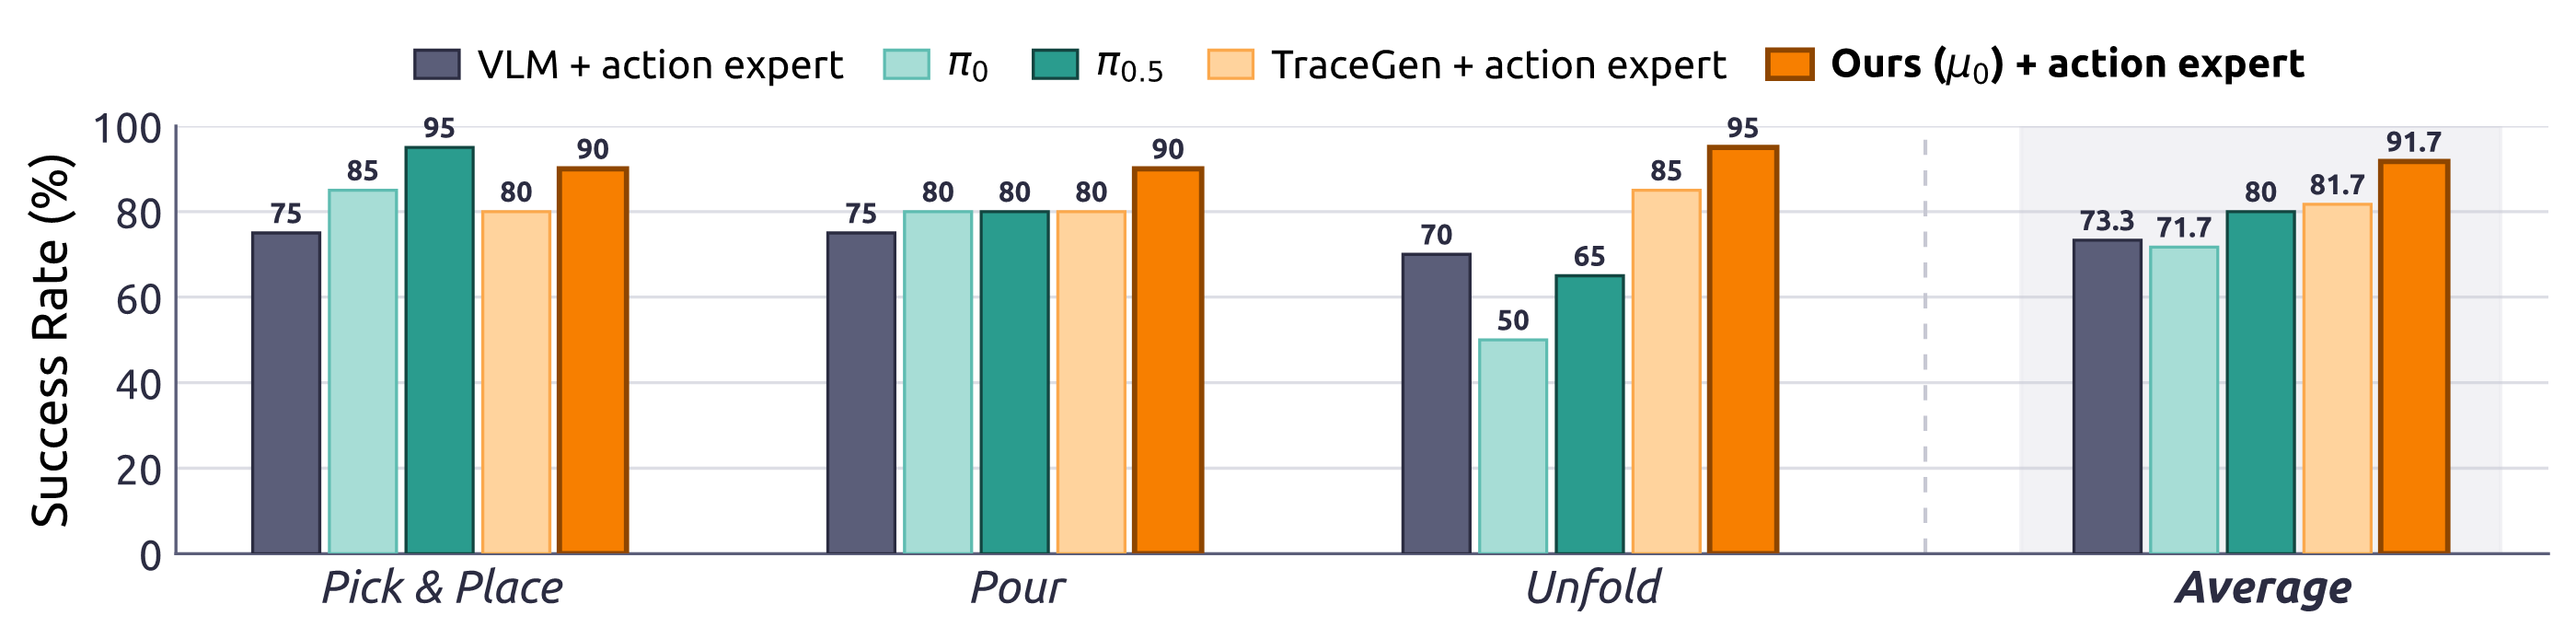
Real-world evaluation results. Bar charts show average success rates (%) for three in-distribution UR3 manipulation tasks. Pick & Place and Pour are averaged over multiple objects.
MolmoMotion:
Forecasting Point Trajectories in 3D with Language Instruction.
Predicts goal-conditioned 3D point trajectories and transfers
to robot manipulation and video generation.
Our work shares the view that 3D trajectories provide a useful intermediate representation, while focusing on trace-space world modeling for actionable robot control through an Action Expert.
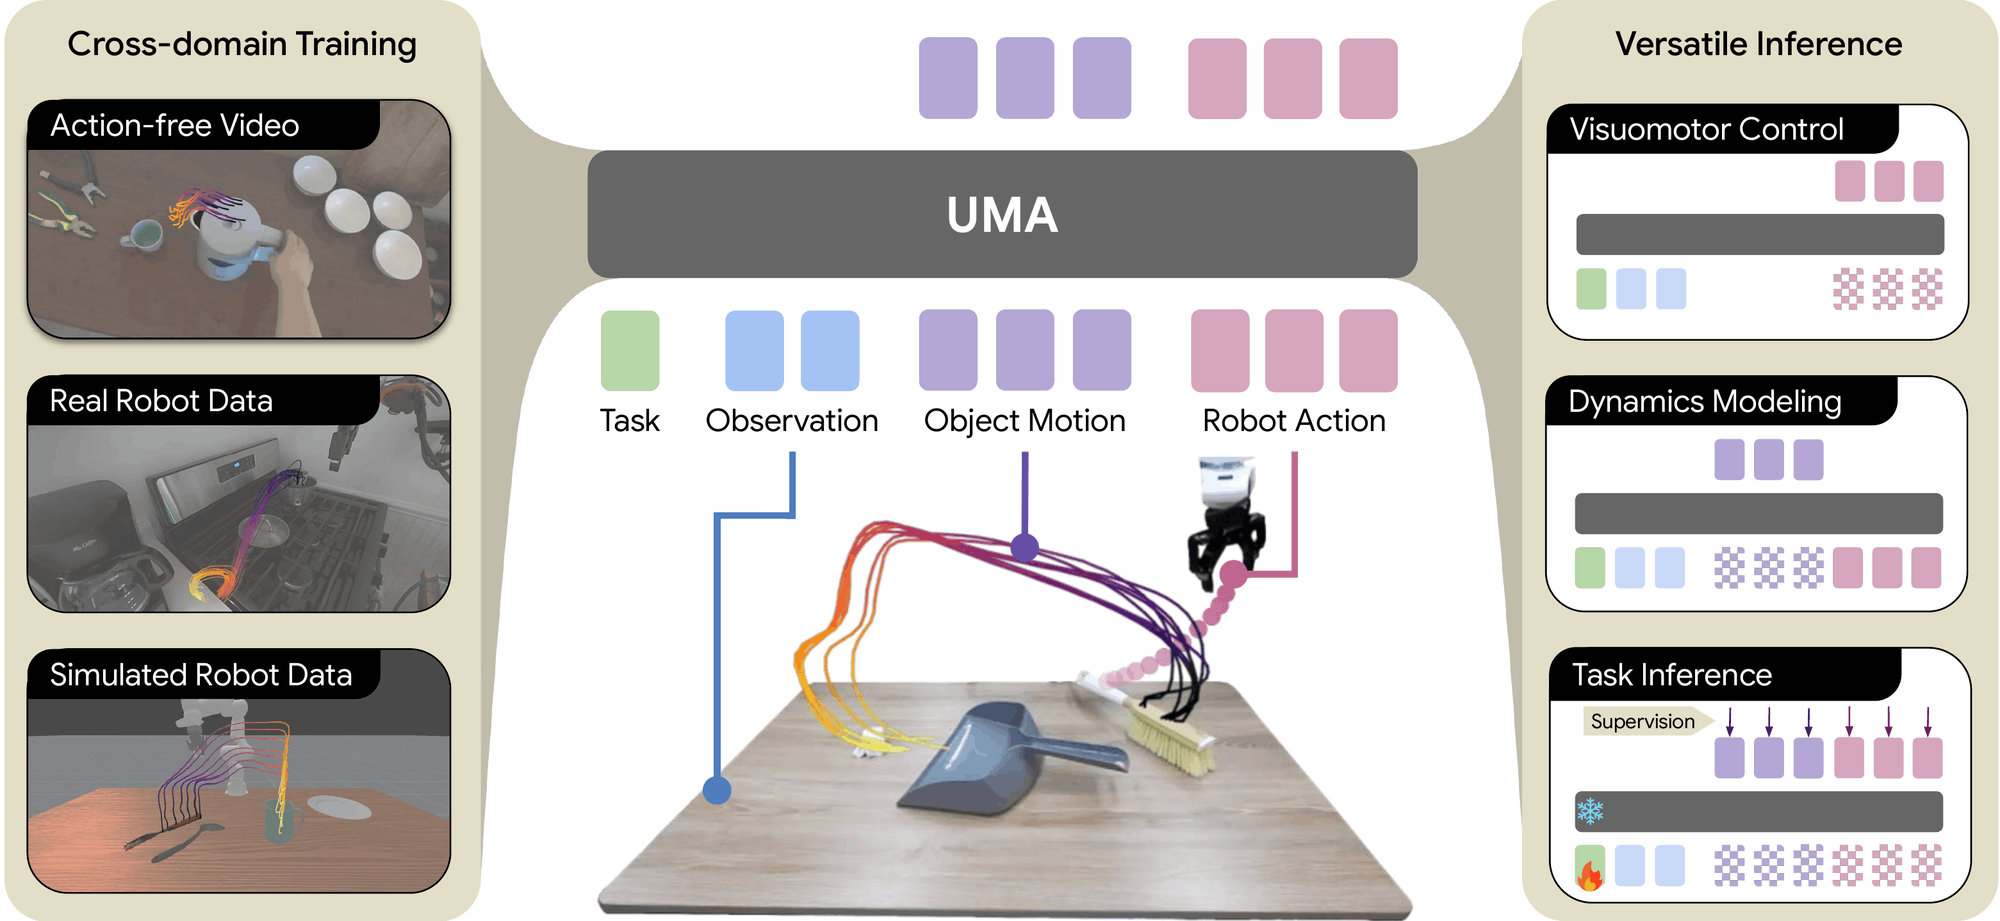
UMA:
Unified Motion-Action Modeling for Heterogeneous Robot Learning.
Uses 3D object motion as a shared interface to jointly model
visuomotor control and dynamics under a masked generative
objective, learning from action-free video, real, and simulated
robot data.
Like ours, UMA treats embodiment-agnostic 3D object motion as the bridge between action-free video and robot control. Our work focuses on video-only pretraining of a trace-space world model, decoding actionable control through a dedicated Action Expert.
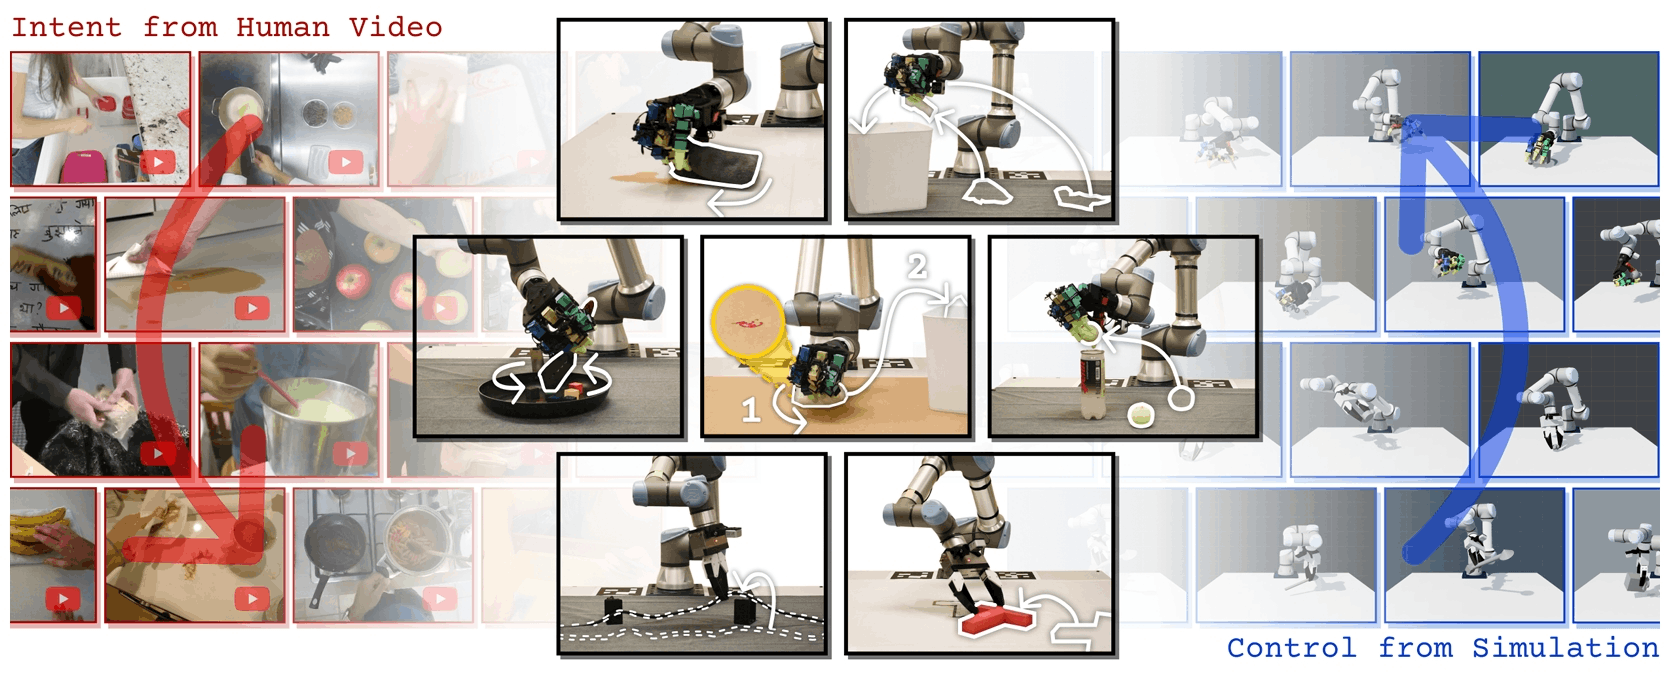
LUCID:
Learning Embodiment-Agnostic Intent Models from Unstructured Human Videos
for Scalable Dexterous Robot Skill Acquisition.
Learns short-horizon manipulation intent from human video as object flow
and palm-pose references, executed by embodiment-specific controllers
trained in simulation.
Like ours, LUCID bridges action-free human video and robot control through an embodiment-agnostic 3D motion interface. LUCID hand-designs an explicit flow-and-palm-pose interface between a separately trained intent predictor and a simulation-RL controller, whereas our work learns a unified trace-space world model from video-only pretraining and decodes control through an Action Expert.
@article{lee2026mu0,
  title={$\mu_0$: A Scalable 3D Interaction-Trace World Model},
  author={Lee, Seungjae and Jung, Yoonkyo and Lee, Jusuk and Shin, Jonghun and Shahidzadeh, Amir Hossein and Lee, Yao-Chih and Kim, H. Jin and Huang, Jia-Bin and Huang, Furong},
  journal={arXiv preprint arXiv:2606.13769},
  year={2026}
}